Unexpected Errors in Lambda Functions
Previously, we looked at how to debug errors in our Lambda function code. In this chapter let’s look at how to debug some unexpected errors. Starting with the case of a Lambda function timing out.
Debugging Lambda Timeouts
Our Lambda functions often make API requests to interact with other services. In our notes app, we talk to DynamoDB to store and fetch data; and we also talk to Stripe to process payments. When we make an API request, there is the chance the HTTP connection times out or the remote service takes too long to respond. We are going to look at how to detect and debug the issue. The default timeout for Lambda functions are 6 seconds. So let’s simulate a timeout using setTimeout.
 Replace our
 get.js with the following:
import handler from "./libs/handler-lib";
import dynamoDb from "./libs/dynamodb-lib";

export const main = handler(async (event, context) => {
  const params = {
    TableName: process.env.tableName,
    // 'Key' defines the partition key and sort key of the item to be retrieved
    // - 'userId': Identity Pool identity id of the authenticated user
    // - 'noteId': path parameter
    Key: {
      userId: event.requestContext.identity.cognitoIdentityId,
      noteId: event.pathParameters.id
    }
  };

  const result = await dynamoDb.get(params);
  if ( ! result.Item) {
    throw new Error("Item not found.");
  }

  // Set a timeout
  await new Promise(resolve => setTimeout(resolve, 10000));

  // Return the retrieved item
  return result.Item;
});
 Let’s commit this code.
$ git add .
$ git commit -m "Adding a timeout"
$ git push
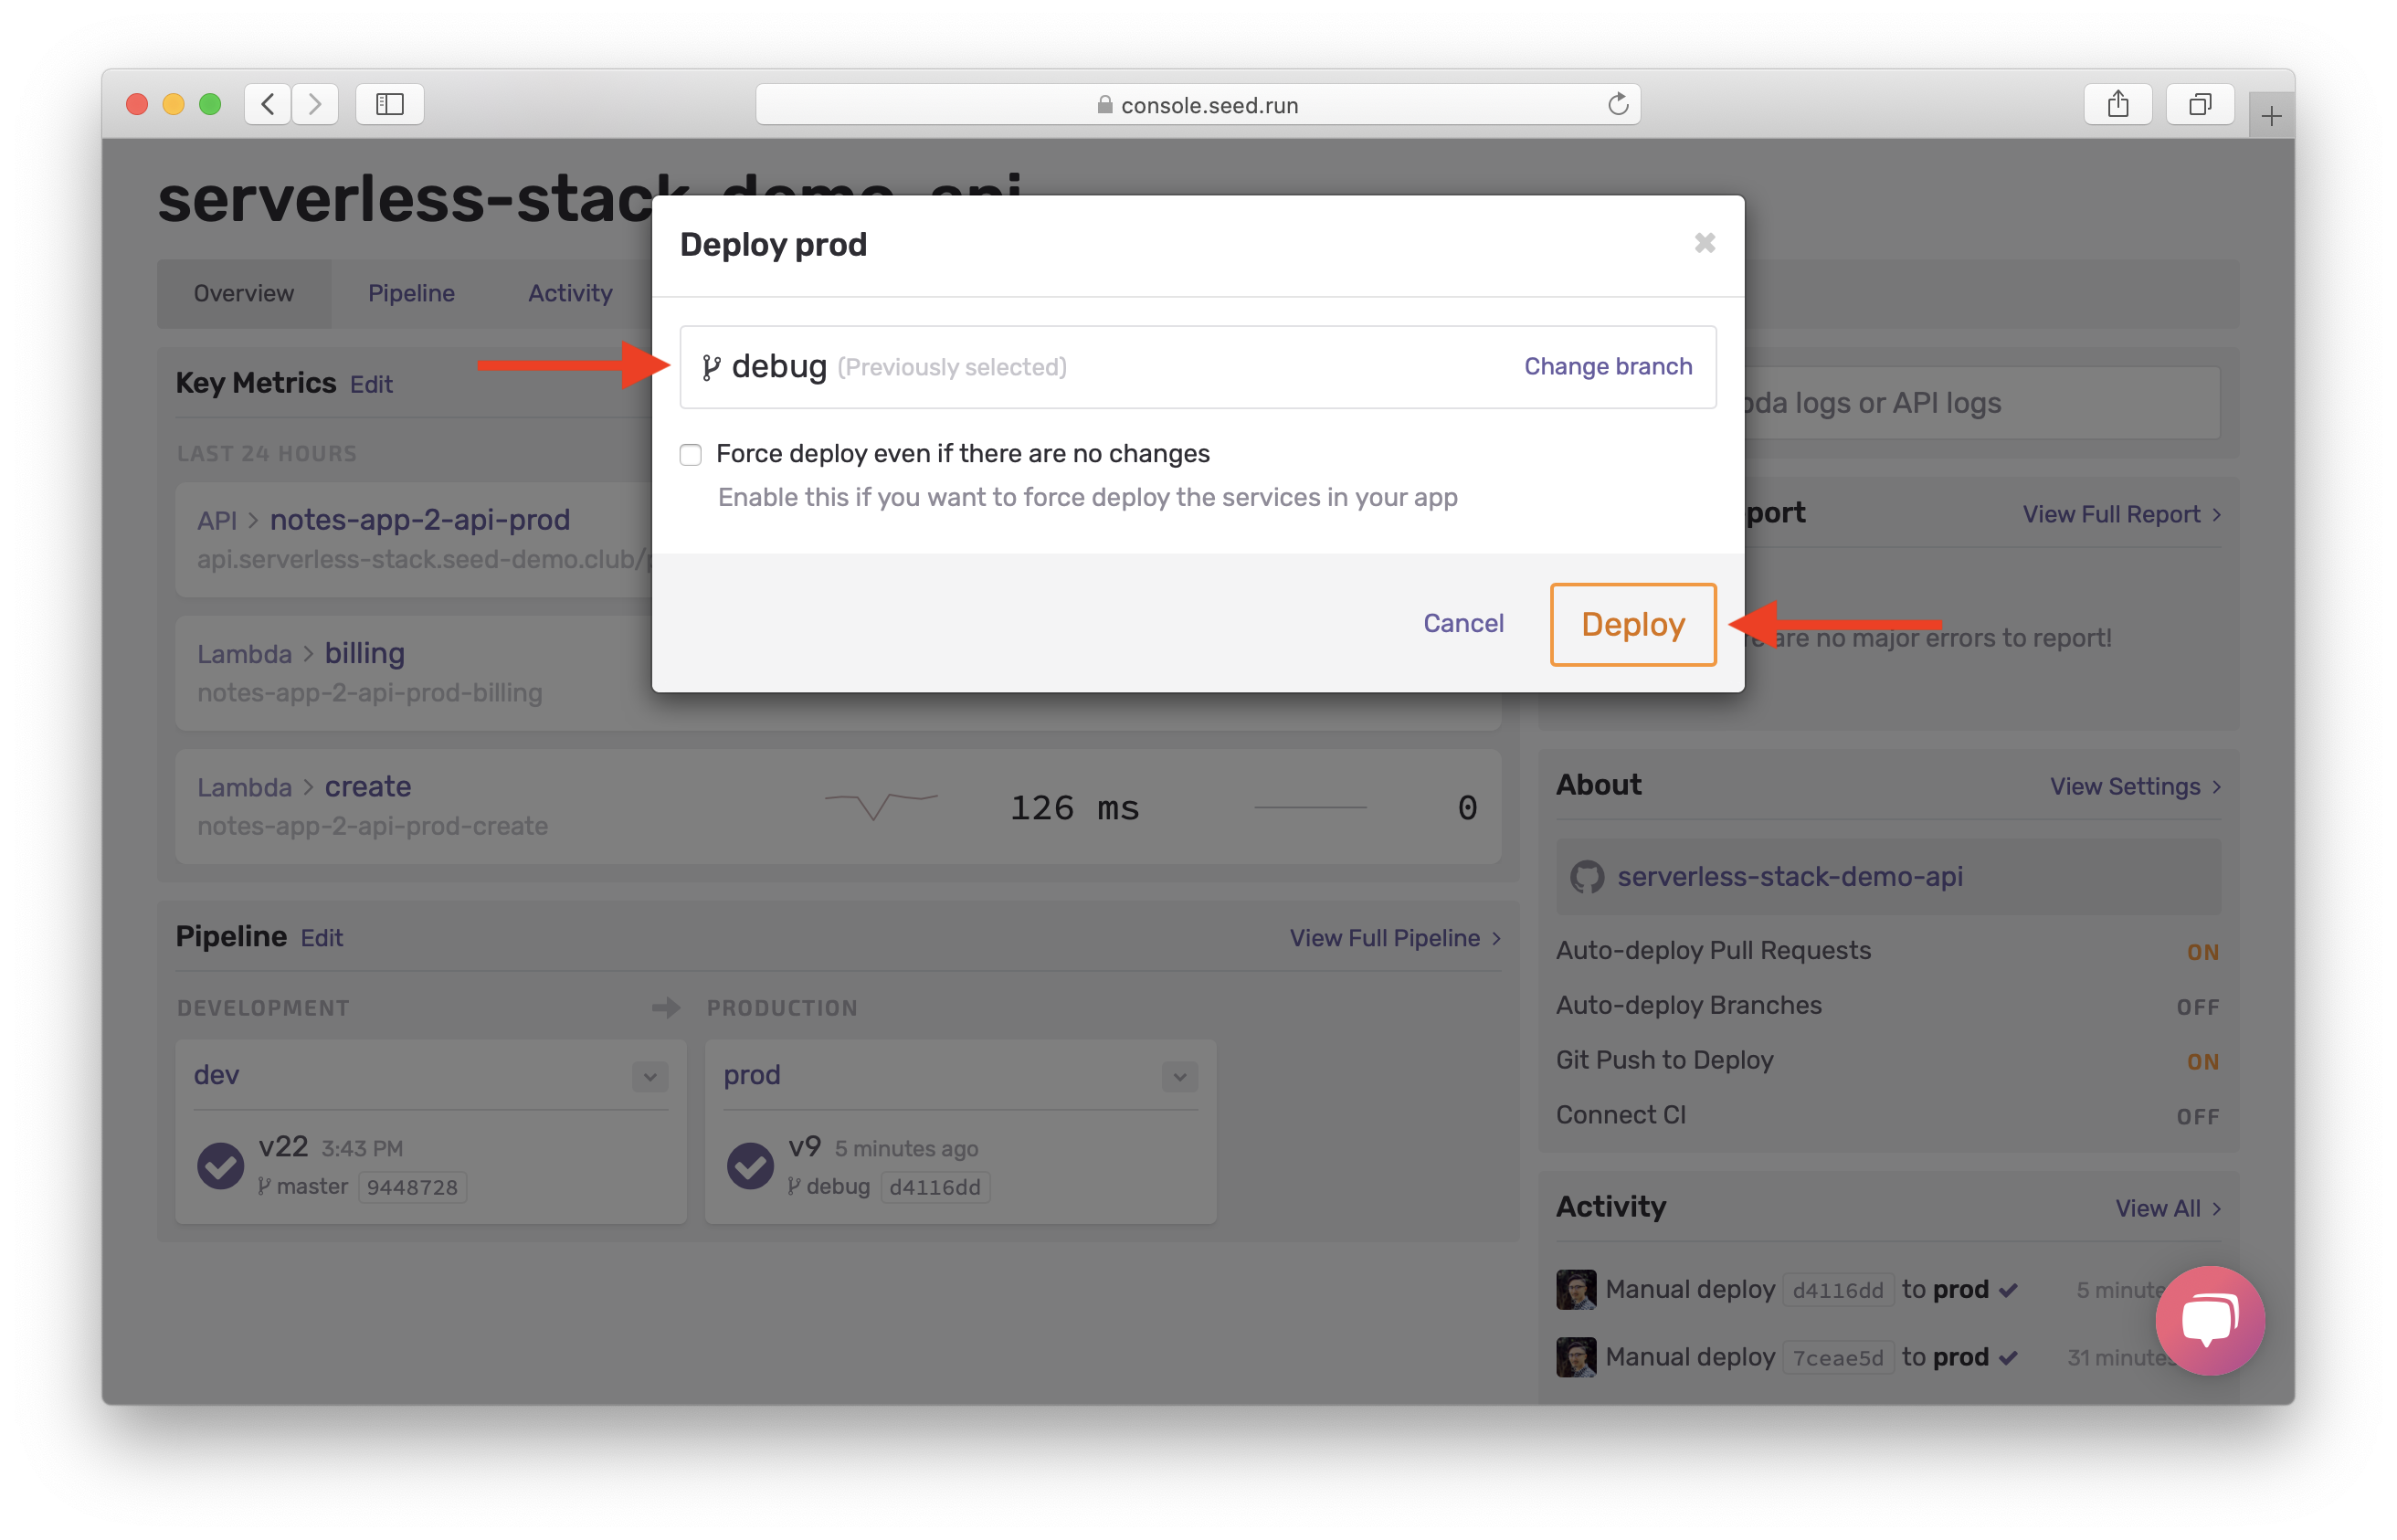
Head over to your Seed dashboard, select the prod stage in the pipeline and deploy the debug branch.
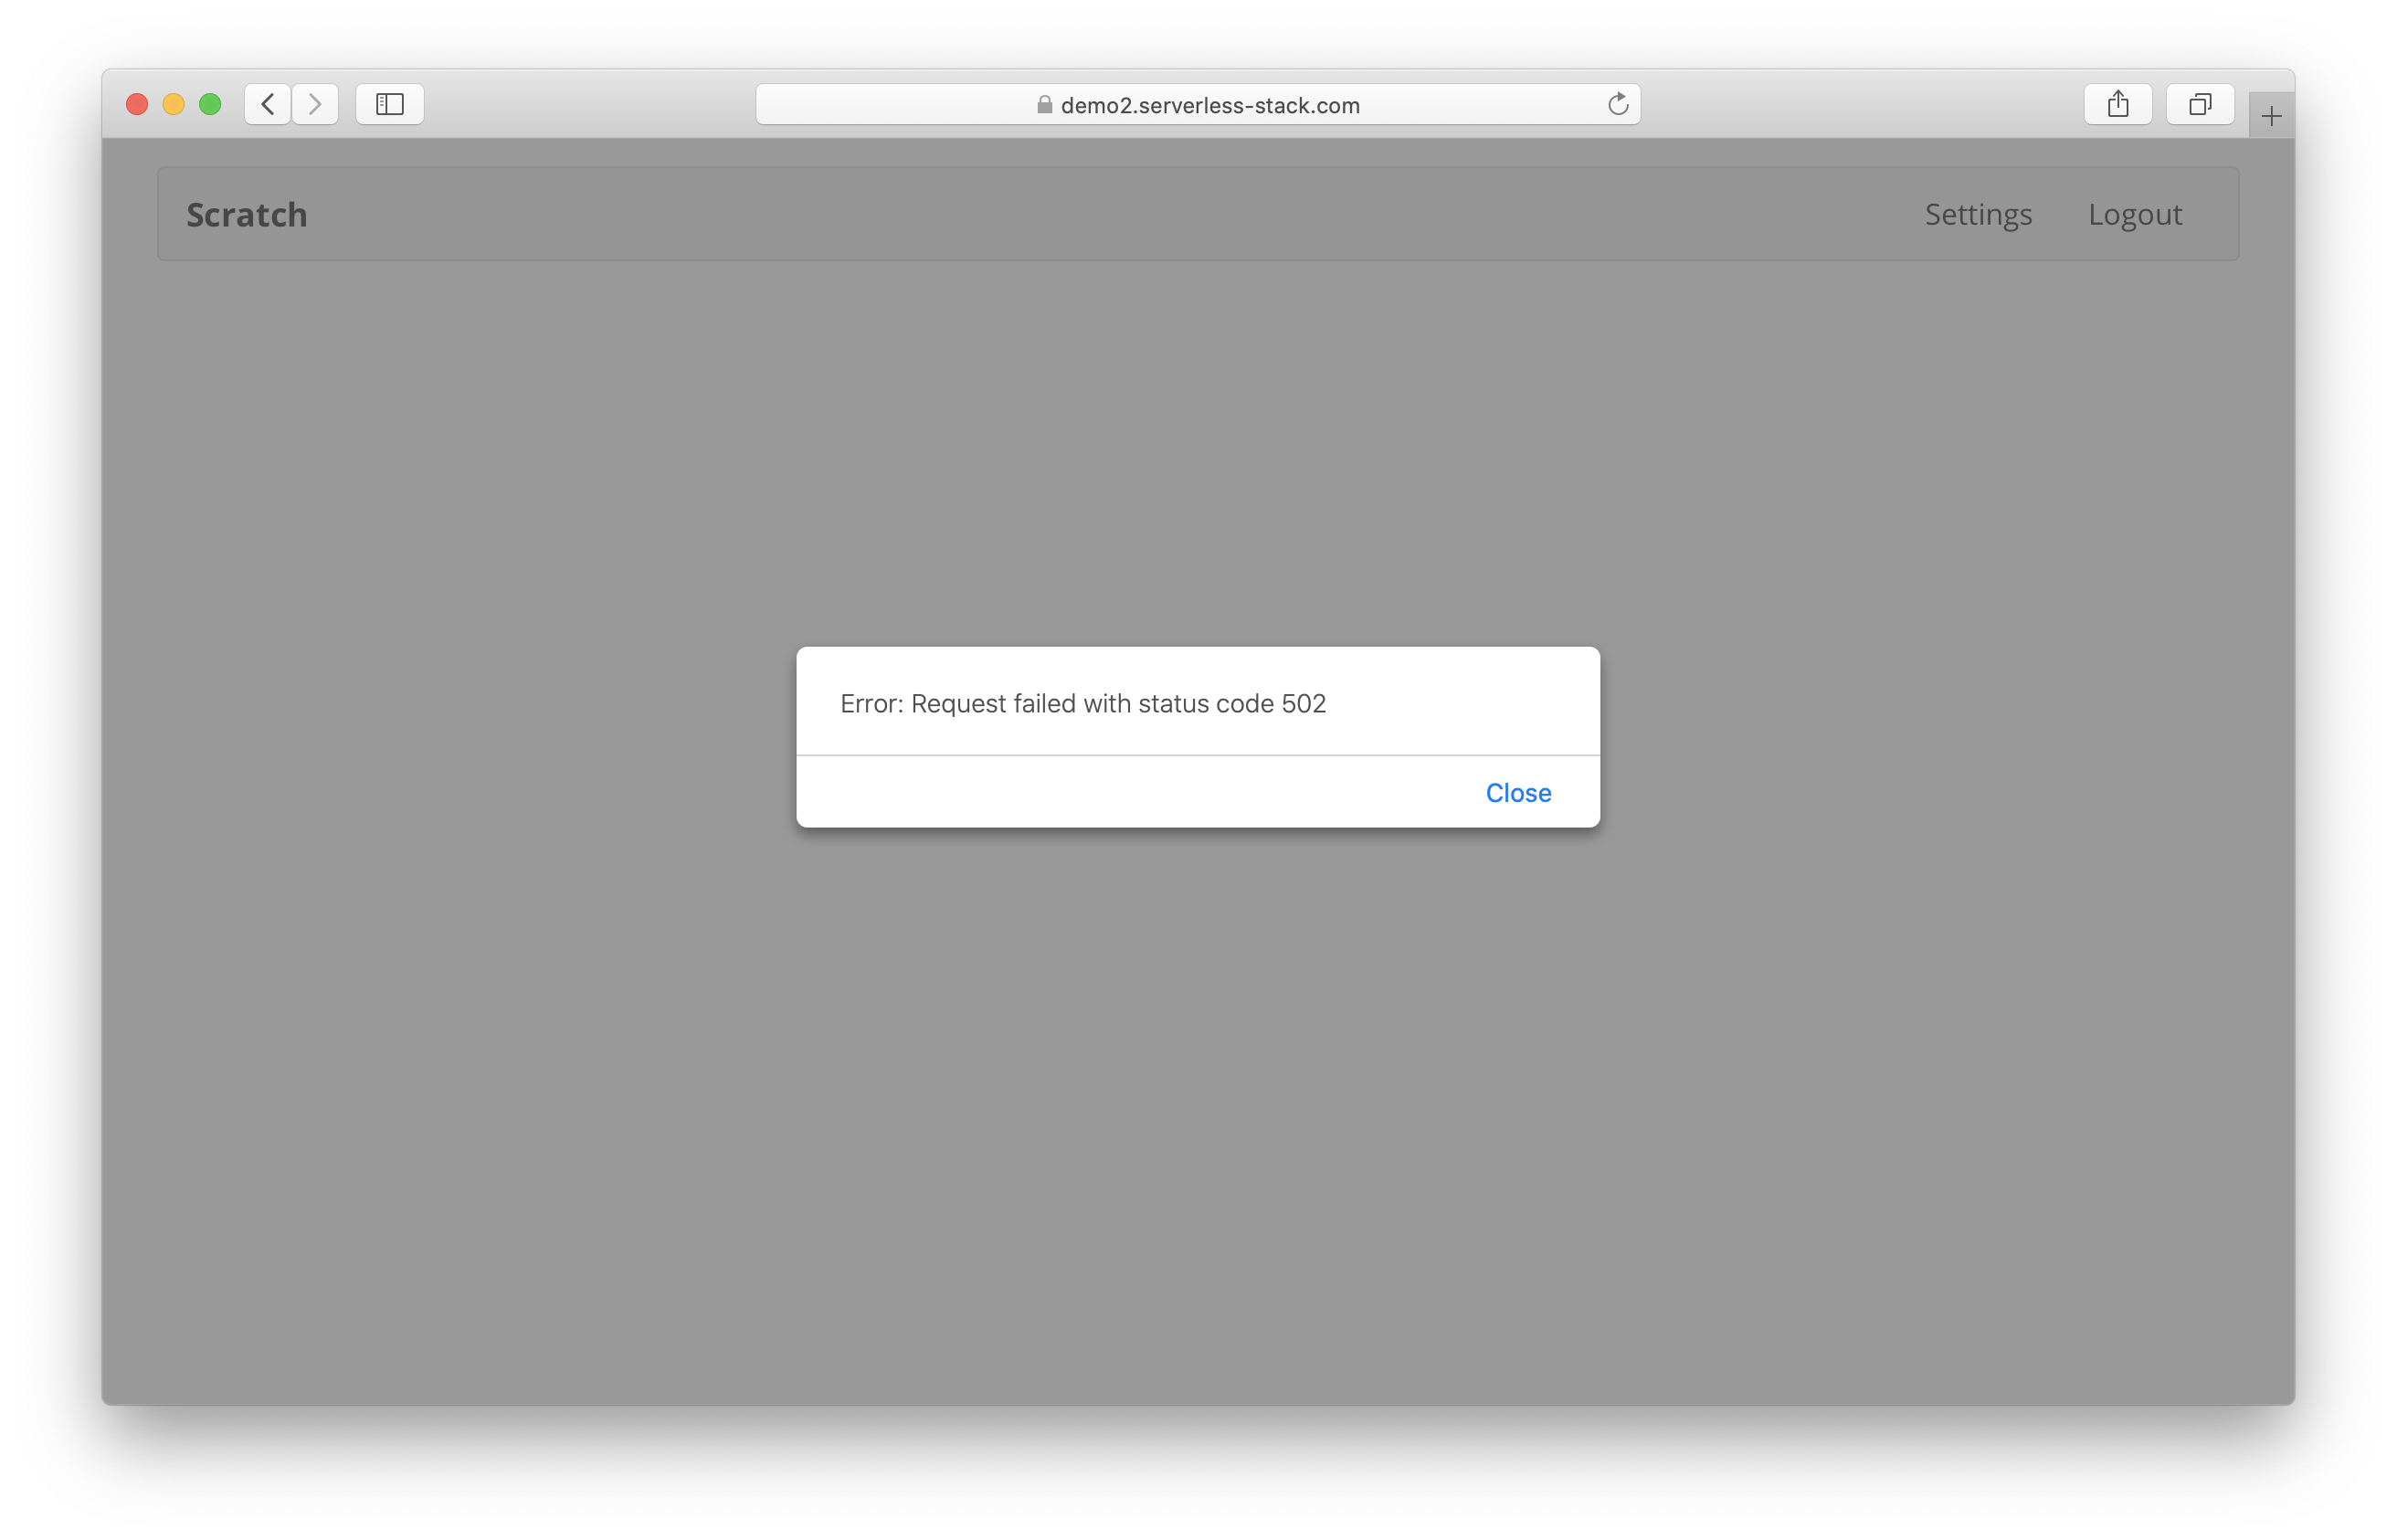
On your notes app, try and select a note. You will notice the page tries to load for a couple of seconds, and then fails with an error alert.
You’ll get an error alert in Sentry. And just like the previous chapter, head over to the logs for the Lambda function in question.
Here you’ll notice that the request took 6006.18ms. And since the Lambda timeout is 6 seconds by default. This means that the function timed out.

Click to expand the request and scroll down to the end of the request.
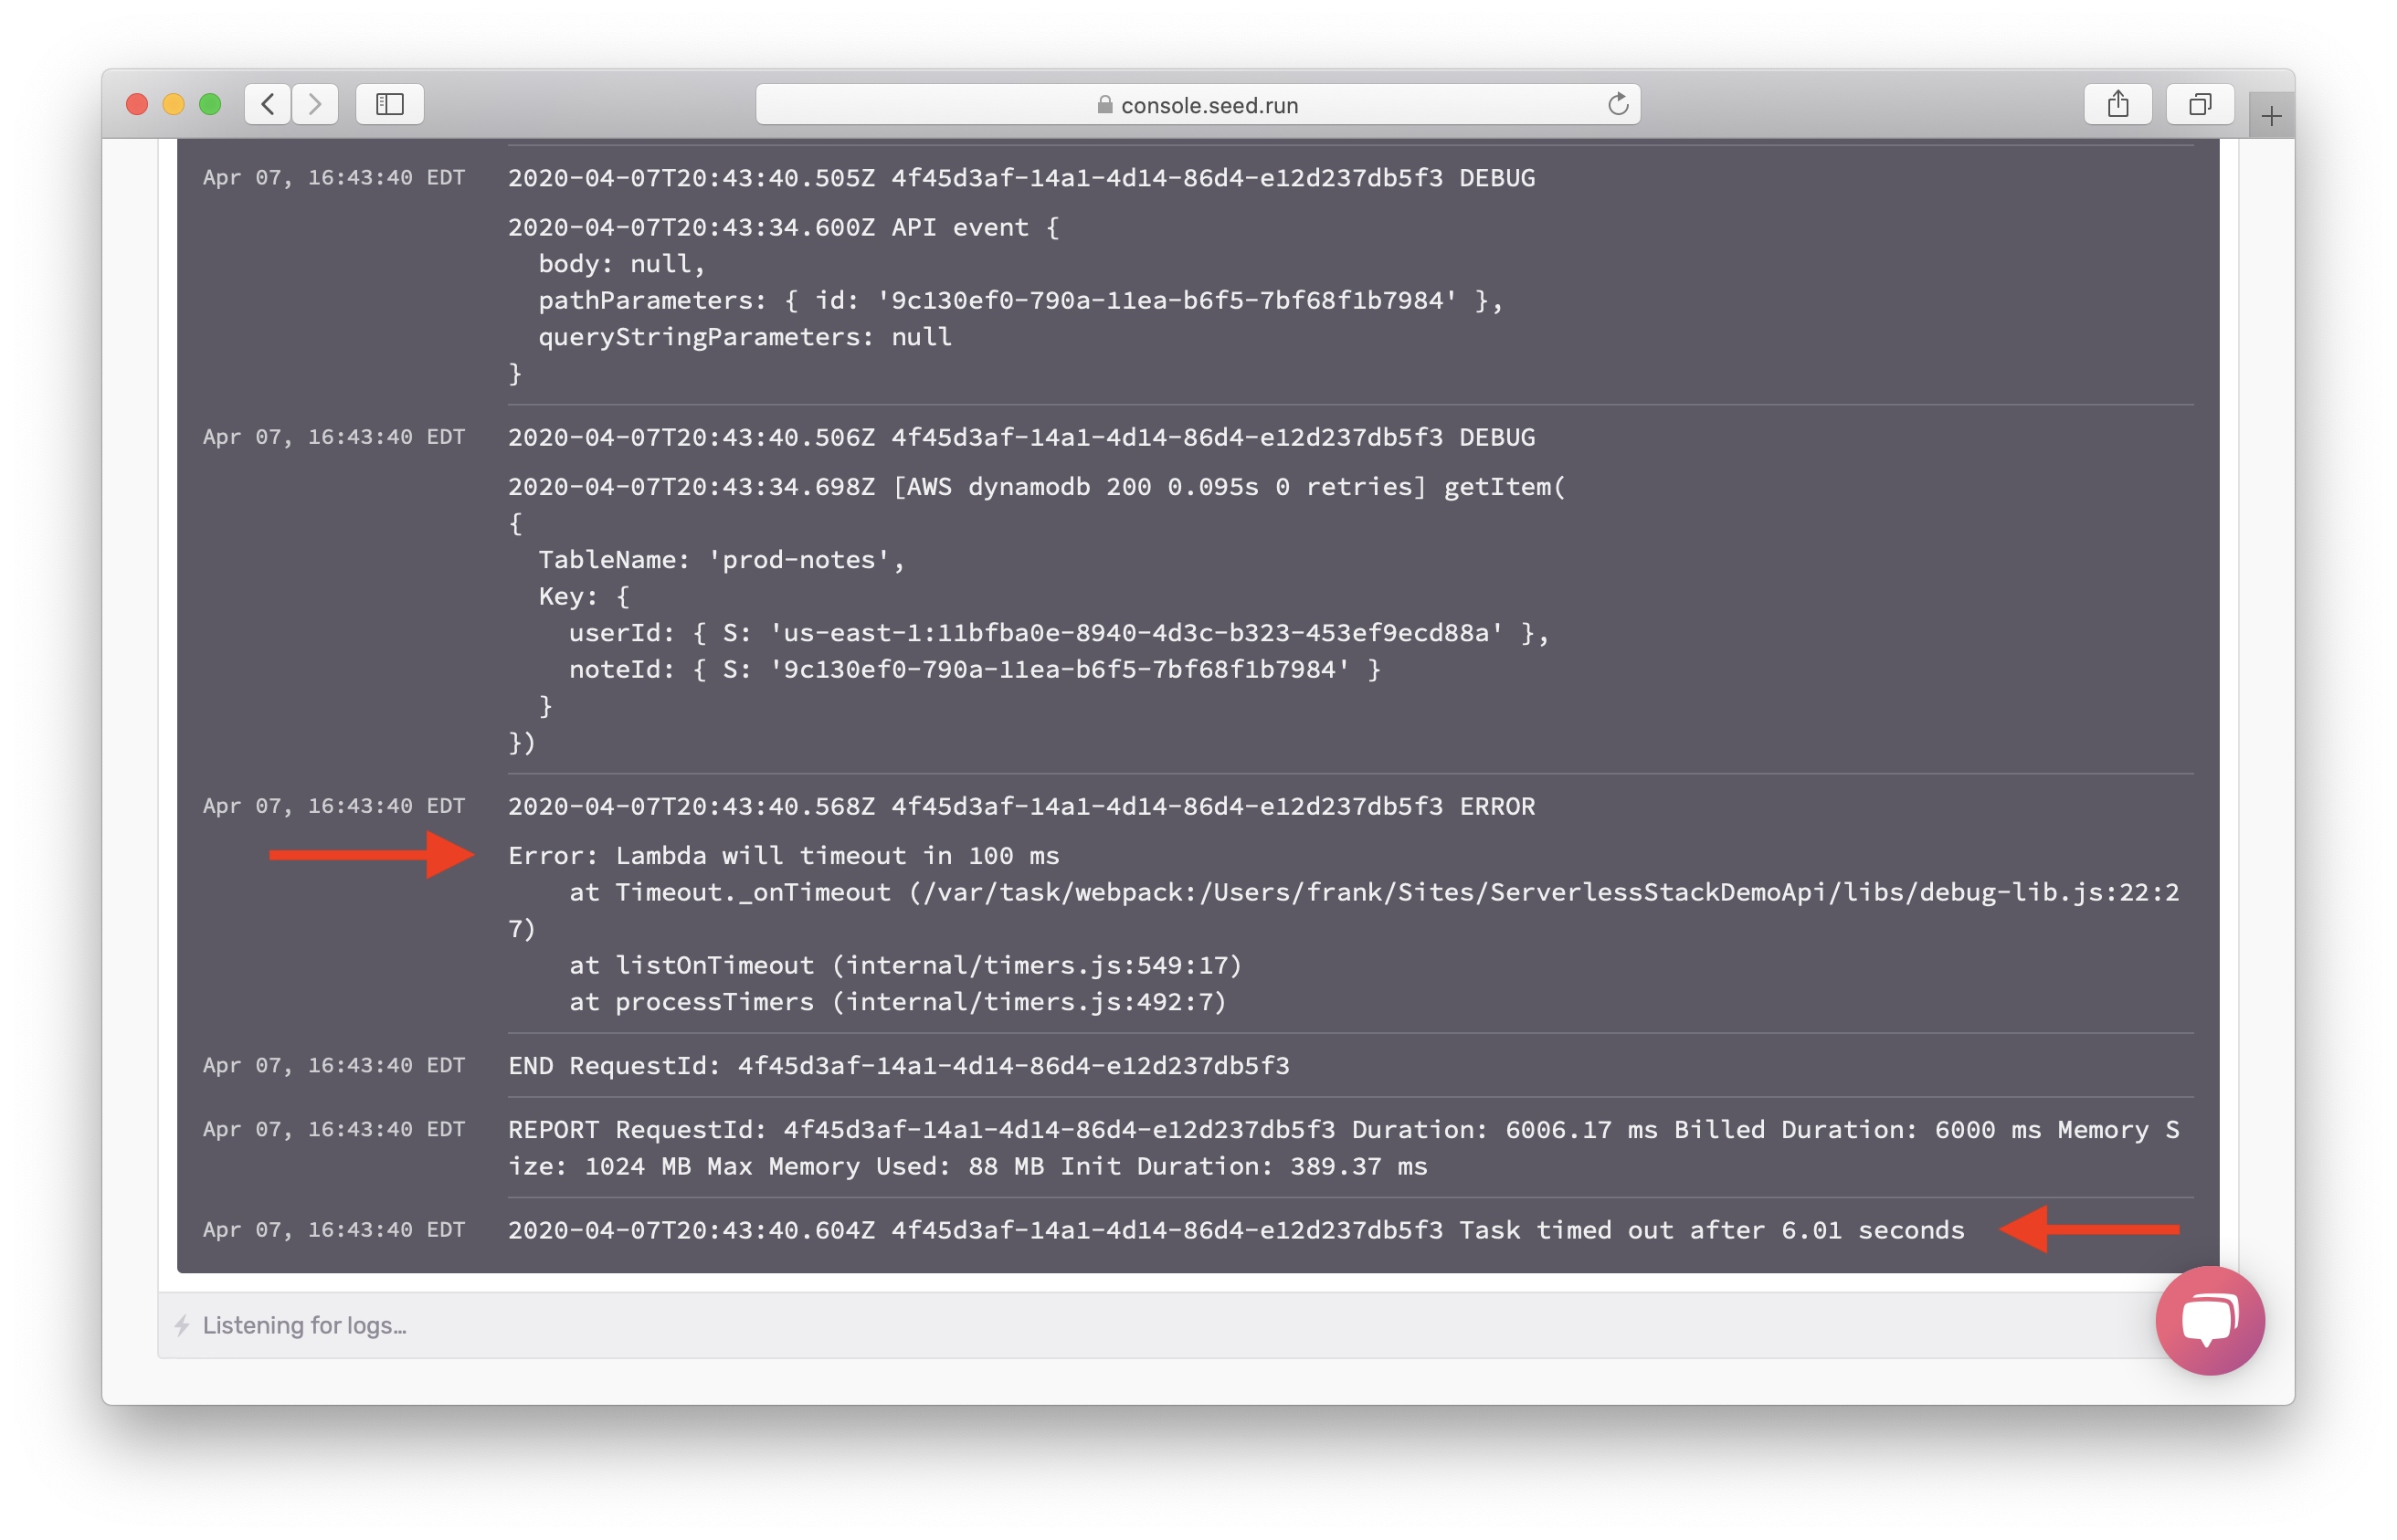
You should see Error: Lambda will timeout in 100 ms. Note, this is printed by the timeout timer in our debugger. We print it out when there is only 100ms left in the Lambda execution.
Also from the debug messages you’ll notice that the last DynamoDB getItem was successful. Meaning that the timeout happened after that!
Next let’s look at what happens when our Lambda function runs out of memory.
Debugging Out of Memory Errors
By default, a Lambda function has 1024MB of memory. You can assing any amount of memory between 128MB and 3008MB in 64MB increments. So in our code, let’s try and allocate more memory till it runs out of memory.
 Replace your
 get.js with:
import handler from "./libs/handler-lib";
import dynamoDb from "./libs/dynamodb-lib";

export const main = handler(async (event, context) => {
  const params = {
    TableName: process.env.tableName,
    // 'Key' defines the partition key and sort key of the item to be retrieved
    // - 'userId': Identity Pool identity id of the authenticated user
    // - 'noteId': path parameter
    Key: {
      userId: event.requestContext.identity.cognitoIdentityId,
      noteId: event.pathParameters.id
    }
  };

  const result = await dynamoDb.get(params);
  if ( ! result.Item) {
    throw new Error("Item not found.");
  }

  const allocations = [];
  while(true) {
    allocations.concat(Array(4096000).fill(1));
  }

  // Return the retrieved item
  return result.Item;
});
Now we’ll set our Lambda function to use the lowest memory allowed and increase the timeout to give it time to allocate the memory.
 Replace the
 get function block in your serverless.yml.
  get:
    # Defines an HTTP API endpoint that calls the main function in get.js
    # - path: url path is /notes/{id}
    # - method: GET request
    handler: get.main
    memorySize: 128
    timeout: 20
    events:
      - http:
          path: notes/{id}
          method: get
          cors: true
          authorizer: aws_iam
 Let’s commit this.
$ git add .
$ git commit -m "Adding a memory error"
$ git push
Head over to your Seed dashboard and deploy it. Then, in your notes app, try and load a note. It should fail with an error alert.
Just as before, you’ll see the error in Sentry. Head over to the Lambda logs in Seed.
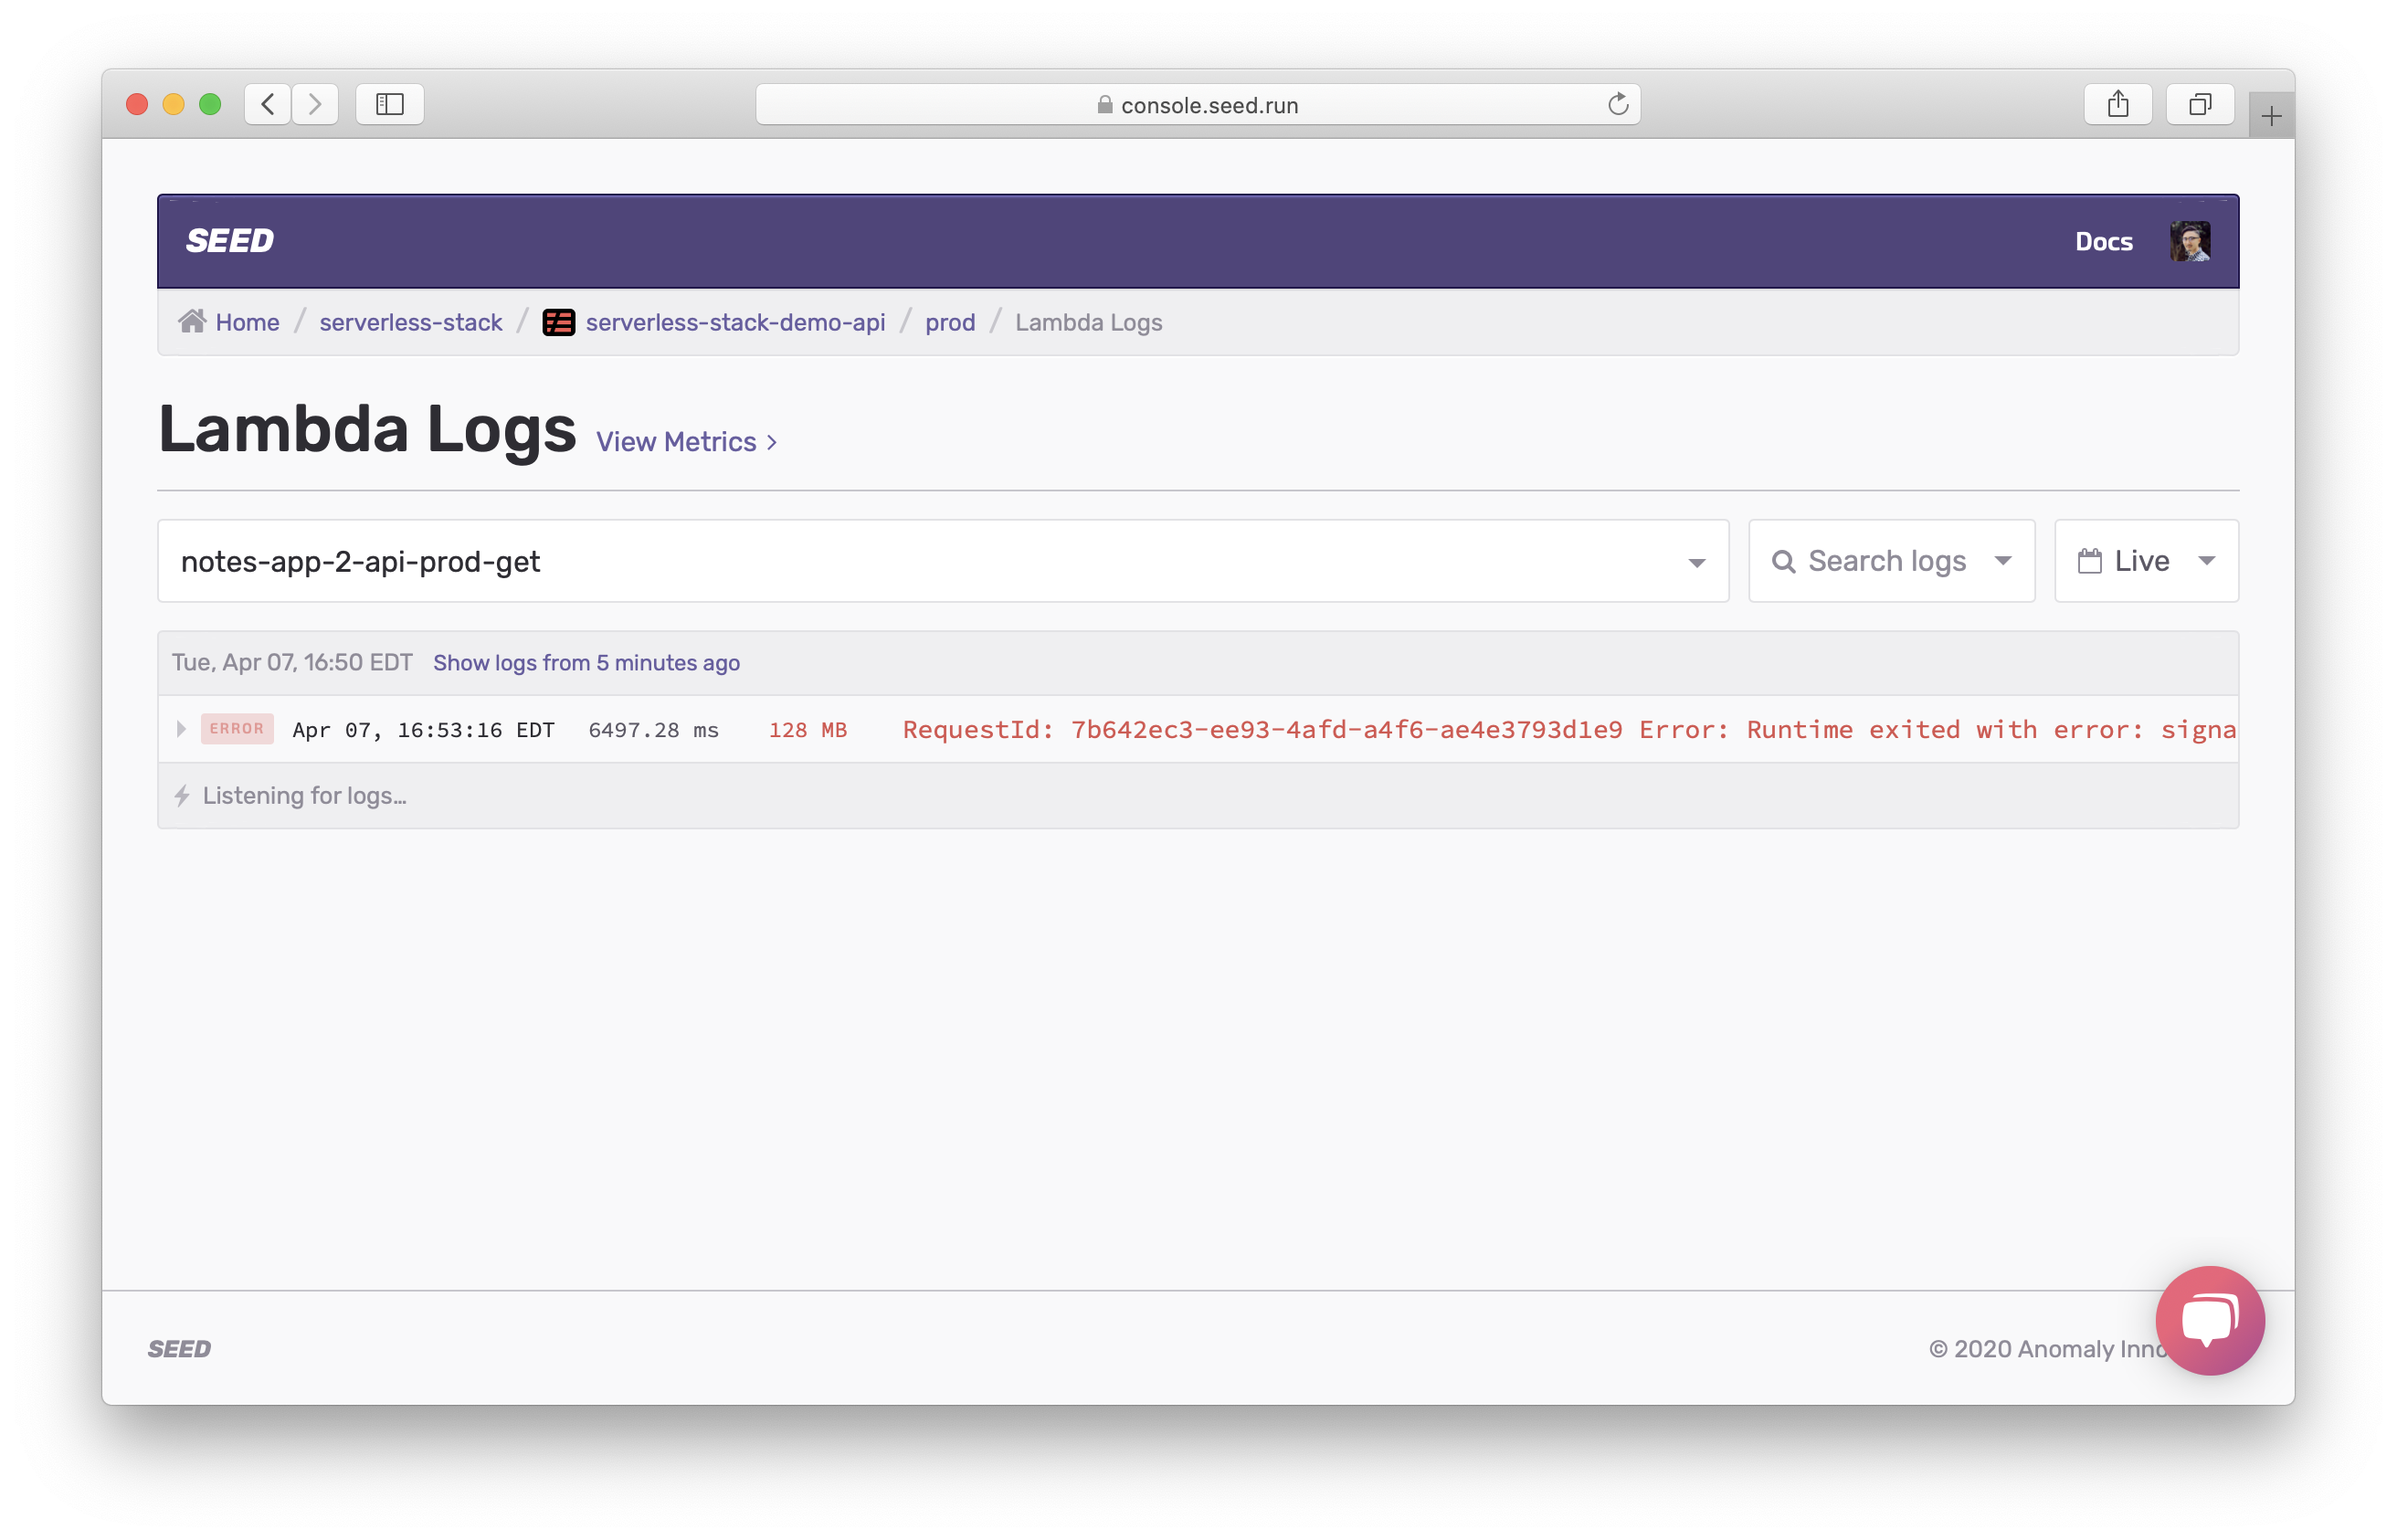
Note the request took all of 128MB of memory. Click to expand the request.
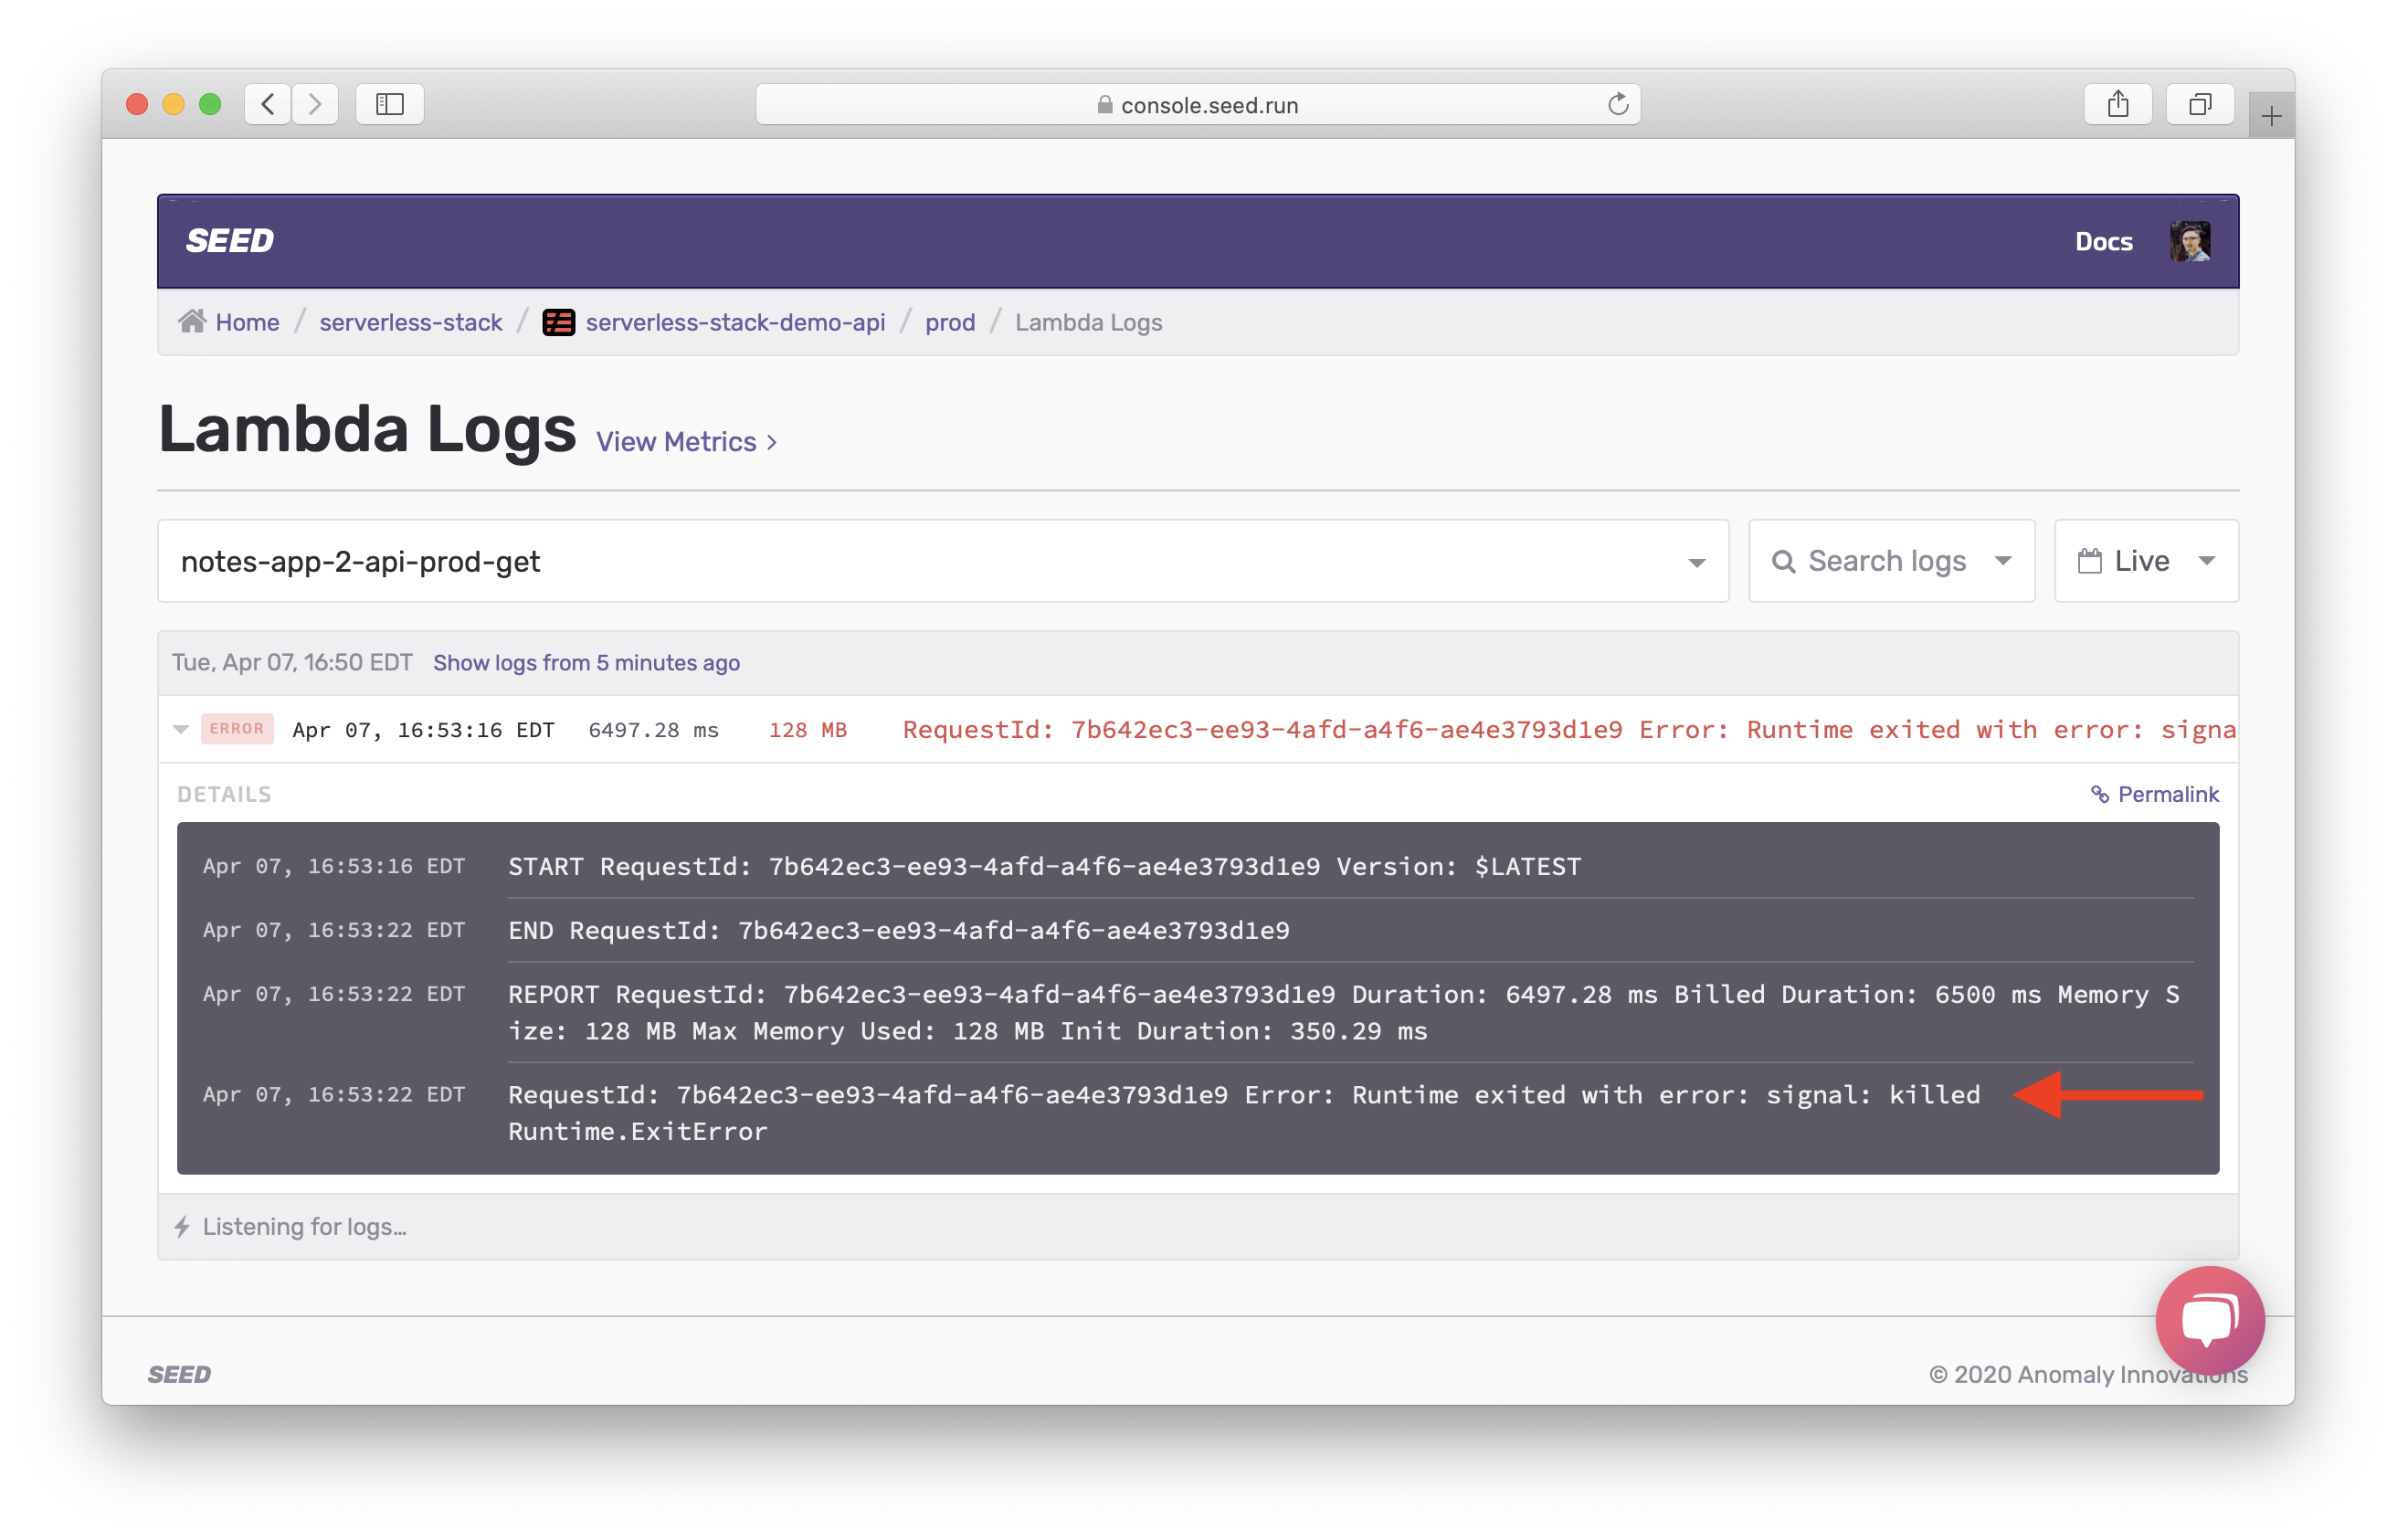
You’ll see Error: Runtime exited with error: signal: killed. This is printed out by Lambda runtime indicating the runtime was killed. Unfortunately, our debug messages are not printed out because the Lambda container was killed without an exception being thrown. But this should give you an idea that your function either needs more memory or that your code is leaking memory.
Next, we’ll look at how to debug errors that happen outside your Lambda function handler code.
For help and discussion
Comments on this chapter